Heading into 2026, that gap is getting harder to ignore. Carrier surcharges keep climbing, freight rates swing unpredictably by lane and season, and margins are tighter across nearly every industry. Data-backed shipping decisions aren't a luxury reserved for Fortune 500 logistics teams anymore. They're becoming table stakes for any business trying to protect its bottom line.
This guide breaks down what shipping data analytics actually is, the KPIs worth tracking, a practical strategy for building your own approach, and the roadblocks that trip up most businesses along the way.
Key Takeaways
- Shipping data analytics turns raw shipment records into decisions on cost, carrier choice, and delivery performance.
- Four analytics types (descriptive, diagnostic, predictive, prescriptive) each answer a different freight question.
- Tracking a handful of the right KPIs beats drowning in reports nobody reads.
- Modern TMS platforms now give small and mid-sized shippers enterprise-grade analytics, no Fortune 500 volume required.
What Is Shipping Data Analytics?
Shipping data analytics is the practice of collecting, organizing, and interpreting data generated across the shipment lifecycle, from quoting and booking through transit, delivery, and invoicing, to guide cost and operational decisions.
It's not the same as pulling a monthly report that shows how many shipments moved last quarter. That's look-back reporting. Real shipping analytics answers forward-looking questions: Where can we cut costs this quarter? Which carrier consistently underperforms on the Chicago-to-Dallas lane? Should we lock in rates now before peak season hits?
Traditional vs. Non-Traditional Shipping Data
Not all shipping data serves the same purpose.
Traditional data includes invoices, transit times, and carrier rates. This information forms the foundation for after-the-fact analysis, helping you determine if last quarter's freight spend matched the budget.
Non-traditional data covers real-time inputs like GPS tracking, weather disruption feeds, and traffic congestion signals. This data helps prevent problems before they cost money, rather than just explaining them afterward.
A shipper who only looks at invoices sees what happened. A shipper who layers in weather and traffic data sees what's about to happen, and can reroute before a storm delays a shipment by three days.
The Four Types of Data Analytics Used in Shipping
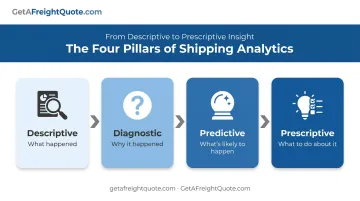
Modern shipping analytics involves four types, each building on the last:
- Descriptive analytics summarizes what happened, such as historical on-time rates or past shipment volumes by lane.
- Diagnostic analytics explains why it happened, digging into root causes behind delays or cost spikes on specific lanes or with specific carriers.
- Predictive analytics forecasts what's likely to happen next, like seasonal demand surges or anticipated rate increases.
- Prescriptive analytics recommends what to do about it, suggesting the optimal carrier, mode, or timing for rate negotiations.
Most small shippers never get past descriptive analytics. That's a missed opportunity, because the real cost savings tend to show up once you move into diagnostic and prescriptive territory.
Why Shipping Data Analytics Matters for Businesses in 2026
Cost pressure is the clearest reason analytics has moved from nice-to-have to necessary. Ground-parcel accessorial charges per package rose 16.4% quarter over quarter in Q4 2024, according to the TD Cowen/AFS Freight Index.
That's on top of an already elevated base rate environment. Fees you didn't budget for are eating into margin faster than most finance teams can track manually.
LTL pricing tells a similar story. The LTL rate-per-pound index hit 65.1% above its January 2018 baseline in Q3 2025, even as average shipment weight declined.
In plain terms: shippers are paying more per pound for lighter loads. Without visibility into where those costs are concentrated, by carrier, lane, or accessorial type, it's nearly impossible to negotiate effectively.
Guesswork is expensive. Businesses that default to expedited shipping "just to be safe" or stick with a single carrier out of habit routinely leave money on the table.
One Schneider case study of an HVAC shipper found:
- $2.25 million in potential annual savings from smarter mode selection alone
- $4 million+ in additional savings from consolidating shipments into a multi-stop truckload model
That's a vendor case study, not a universal guarantee, but it illustrates the scale of savings hiding in plain sight when decisions are data-driven instead of reflexive.
The broader market is catching on. In a survey of more than 700 manufacturing and supply-chain leaders, 55% reported increasing their supply-chain technology investment, according to MHI and Deloitte's 2026 industry report.
60% planned to spend over $1 million. Businesses that sit out this shift risk falling behind on both cost and service, not because their competitors are smarter, but because they're seeing more of their own data.
Essential Shipping KPIs Every Business Should Track
A KPI, or key performance indicator, is a quantifiable metric measured against a benchmark or goal. It's different from raw data because it tells you whether something is good or bad, not just what happened. Tracking too many metrics is as unproductive as tracking none. Here's what actually moves the needle.
On-Time Delivery Rate and OTIF
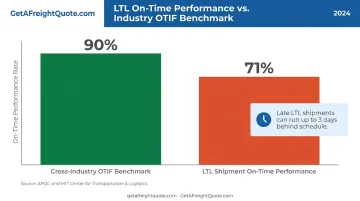
On-time delivery (OTD) measures whether shipments arrive when promised. OTIF (on-time in-full) goes further, measuring both timeliness and order completeness. APQC's cross-industry benchmark puts median OTIF around 90%, though that figure spans 45 industries and isn't a mode-specific target.
LTL performance tends to run lower. One 2025 MIT Center for Transportation & Logistics study of shipper LTL data found average on-time performance closer to 71%, with late shipments running as much as three days behind schedule.
Cost Per Shipment and Freight Spend as a Percentage of Revenue
Tracking cost per shipment over time reveals overspending trends before they become permanent line items. Freight spend as a percentage of revenue (total transportation cost divided by revenue) supports smarter budgeting, letting you flag when costs are creeping up relative to sales rather than just in absolute dollars.
Transit Time Variance and Carrier Exception Rate
These two metrics flag underperforming carriers or problem lanes early. Transit time variance shows how far actual delivery deviates from published or scheduled transit time, while carrier exception rate tracks how often a carrier triggers delays, damage, or service failures relative to total shipments.
A carrier that looks cheap on paper but consistently runs late on a key lane isn't actually saving you money.
Freight Claims and Damage Rate
Tracking claims and damage frequency informs both carrier selection and packaging decisions. If one carrier's damage rate on a specific lane is double the others, that's a signal worth acting on, whether through a carrier switch or a packaging redesign.
Rate Accuracy and Quote-to-Invoice Variance
This one gets overlooked constantly. Quote-to-invoice variance tracks the gap between what you were quoted and what you were actually billed. For LTL and FTL shippers especially, this is a key transparency metric: reclassification fees, accessorial surprises, and dimensional weight adjustments can inflate a shipment's final cost well above the original quote.
Automated freight audit tools, like the invoice recovery feature in GetAFreightQuote.com's platform, catch these discrepancies before they erode margins.
Building Your Shipping Data Analytics Strategy: A Step-by-Step Approach
Knowing which KPIs matter is only half the equation. Here's how to actually put analytics to work.
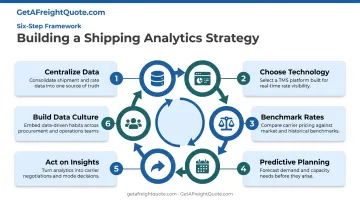
Centralize your data. Stop relying on scattered spreadsheets and separate carrier portal logins. Shipment, carrier, and invoice data needs to live in one place before any analysis is meaningful.
Choose the right technology. Modern TMS platforms bundle rate benchmarking, carrier comparison, and invoice transparency into one dashboard. GetAFreightQuote.com extends this same enterprise-grade technology and negotiated carrier rates to businesses without Fortune 500 shipment volume, displaying live parcel, LTL, and FTL rates side by side for direct comparison.
Benchmark carrier rates and performance regularly. This isn't a one-time exercise. GetAFreightQuote.com's rate-shopping tool lets businesses connect existing carrier accounts and shop those rates alongside its pre-negotiated options. You'll know instantly whether your contracts are still competitive.
Use predictive analytics for seasonal planning. Forecasting peak-season volume and rate fluctuations lets you negotiate capacity and lock in budget in advance, rather than scrambling when demand spikes and rates follow.
Act on the insights. Data sitting in a dashboard doesn't save money by itself. Use documented performance and cost trends to renegotiate carrier contracts, shift volume to better-performing carriers, or adjust mode selection on specific lanes.
Build a data-driven culture. Train staff to use the dashboards, and tie team goals to shipping KPIs rather than treating analytics as a one-time IT project. Lasting savings come from teams that keep checking the numbers, not those that run a single audit and move on.
Common Challenges in Shipping Data Analytics
Even businesses that want to get serious about analytics run into predictable obstacles.
Fragmented data across carriers and systems. When shipment records, invoices, and tracking data live in separate carrier portals, building a unified performance view becomes a manual, error-prone chore. Centralized or API-based platforms solve this by pulling quoting, booking, tracking, and invoicing into one dashboard. GetAFreightQuote.com's TMS, for example, consolidates billing across every carrier into a single invoice.
Shortage of in-house expertise. A shipping analyst monitors carrier performance, benchmarks costs against market rates, and recommends mode adjustments. That's a valuable skill set, but most small businesses can't justify a full-time hire for it. Analytics-equipped TMS partners fill that gap. GetAFreightQuote.com's Managed LTL Services, for example, handle benchmarking, carrier procurement, and performance governance without requiring an internal analyst on payroll.
Resistance to new technology. Enterprise analytics tools historically carried a reputation for being expensive and complicated, built for companies with dedicated IT budgets. That perception has kept smaller shippers on the sidelines even as the tools became more accessible. Platforms priced per label, sometimes just a few cents per shipment, have closed that gap, making the cost barrier far smaller than the reputation suggests.
Frequently Asked Questions
What does a shipping analyst do?
A shipping analyst monitors shipment and carrier performance data, benchmarking costs against market rates. They identify inefficiencies and recommend carrier or route adjustments to improve service and reduce spend.
What is KPI in shipping?
A shipping KPI is a measurable metric, such as on-time delivery rate or cost per shipment. It's used to evaluate and benchmark logistics performance against specific goals, not just describe raw activity.
What is big data analytics in the shipping industry?
Big data analytics in shipping combines large volumes of traditional data, like invoices and transit times, with non-traditional data such as GPS, weather, and sensor feeds. This blend uncovers patterns that improve cost and delivery decisions beyond standard reporting.
What are the four types of data analytics used in shipping?
They are descriptive (what happened), diagnostic (why it happened), predictive (what's likely to happen), and prescriptive (what to do next). Each builds on the previous one for deeper insight.
How can small and mid-sized businesses access enterprise-grade shipping analytics without a big budget?
Authorized TMS resellers like GetAFreightQuote.com give smaller shippers access to the same negotiated rates and analytics tools used by large corporations, without requiring high shipment volume to qualify.
What tools or software are commonly used for shipping data analytics?
The main tools are TMS platforms for rate shopping and booking, plus business intelligence dashboards for spend analysis. Exception management systems also play a role, flagging delays or billing errors before they compound.