Freight data analytics changes that. Technology that was once available only to Fortune 500 companies with dedicated logistics teams is now built into modern TMS platforms, giving businesses of any size the power to make smarter, faster, data-backed shipping decisions. According to Descartes' 2025 benchmark survey covering more than 600 global shippers and logistics providers, 81% now view transportation as a competitive weapon—not just a cost center.
This article breaks down what freight data analytics is, which metrics matter most, and how to get started without enterprise budgets or data science teams.
Key Takeaways
- Freight data analytics turns shipping data into cost savings, carrier insights, and accurate budgets
- Modern TMS platforms give small and mid-sized shippers enterprise analytics without BI tools or data teams
- Track total spend, cost per shipment, on-time rates, and invoice accuracy before adding forecasting
- Pair shipment history with market rate benchmarks to spot overpaying and underperforming carriers
What Is Freight Data Analytics?
Freight data analytics is the process of collecting, analyzing, and interpreting data from your shipping operations to make better logistics decisions. It supports decisions about moving goods quickly, sustainably, and cost-effectively—from choosing the right carrier and mode to negotiating rates and planning capacity.
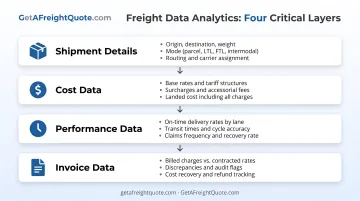
Analytics examines multiple data layers:
- Shipment details: origin, destination, weight, dimensions, freight class, and transportation mode
- Cost data: base freight rates, fuel surcharges, accessorial charges, insurance, and total landed cost
- Performance data: on-time pickup and delivery rates, transit times, claims rates, and invoice accuracy
- Invoice data: billed charges, contracted rates, discrepancies, and recovery opportunities
Unlike simply reviewing individual invoices, analytics reveals patterns and trends that aren't visible when looking at one shipment at a time. For example, a carrier with competitive base rates may consistently add accessorials that make them more expensive overall. A specific lane may also have become 20% more costly over the past six months.
Tools that once required enterprise TMS implementations costing $150,000–$250,000 are now available through cloud platforms at per-shipment pricing.
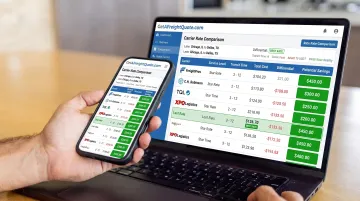
Platforms like GetAFreightQuote.com include built-in spend analytics, carrier scorecards, and market-rate benchmarking. Small and mid-sized shippers can compare negotiated rates against live market data and track performance without legacy enterprise software.
Shippers using analytics make data-backed decisions on carrier selection, routing, and budgeting instead of relying on outdated assumptions or the loudest sales rep. Only 20% of shippers are satisfied with their current visibility, while more than 80% want real-time insights and proactive alerts. Analytics closes that gap.
Key Benefits of Freight Data Analytics for Shippers
Cost Optimization and Savings
Analytics identifies true freight cost drivers by breaking down spending by lane, carrier, mode, service level, and accessorial charges. Instead of seeing one monthly total, you understand where money actually goes, whether it's residential delivery fees, liftgate charges, or fuel surcharges that vary by carrier.
This visibility strengthens carrier negotiations. When you show carriers data on shipping patterns, volumes, consistency, and lane density, you negotiate from strength rather than accepting published rates. Analyst research suggests TMS platforms can reduce transportation costs, though results vary by shipper size, lane mix, and baseline rates.
Savings come from concrete mechanisms:
- Invoice auditing catches billing errors
- Market benchmarking reveals when you're overpaying
- Mode optimization shifts freight to lower-cost options where service allows
For example, GetAFreightQuote.com's platform compares your existing carrier contracts with more than 100 carrier rates in real time, helping shippers identify whether their negotiated pricing is genuinely competitive or whether another option delivers lower total cost on a given lane.
Improved Carrier Performance Management
Analytics tracks carrier reliability across key metrics:
- On-time pickup and delivery
- Claims rates
- Invoice accuracy by carrier
Carrier scorecards should include invoice accuracy, timely invoicing, and on-time delivery as baseline KPIs.
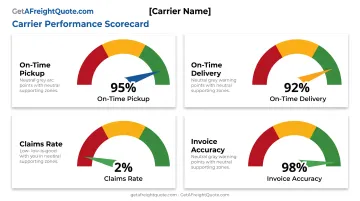
Data helps identify underperforming carriers before they impact your customers. If a carrier's on-time delivery rate drops from 95% to 88% over two months, you can address the issue proactively: shifting volume, renegotiating service commitments, or replacing the carrier rather than waiting for customer complaints.
Enhanced Operational Efficiency
Real-time visibility reduces time spent tracking shipments. Instead of calling carriers for updates or forwarding email chains, teams access live status data in one dashboard, allowing faster exception management and proactive customer communication.
Analytics also streamlines collaboration. Teams share data-driven insights, such as which lanes have the longest transit times or which carriers require the most follow-up, instead of relying on anecdotal observations or individual experience.
Better Budgeting and Forecasting
Historical data improves budget accuracy. Analyzing past shipping patterns, seasonal volume shifts, and cost trends leads to more realistic freight budgets. Rate, volume, and capacity trends support transportation budgets, bids, and pricing decisions, according to ACT Research.
Predictive analytics helps anticipate cost changes. By layering external market signals (such as diesel prices, capacity constraints, or rate indices) over your own lane history, you can spot rate increases or service disruptions before they impact your budget.
Risk Management and Compliance
Analytics identifies potential disruptions by monitoring factors such as weather patterns, traffic data, geopolitical events, and capacity shifts. Freight forecasting incorporates weather, natural disasters, geopolitical events, and capacity disruptions to support proactive planning.
Data also supports compliance by verifying carriers meet insurance, licensing, and safety requirements. Useful public sources include:
- FMCSA's Licensing and Insurance system for carrier authority and insurance data
- FMCSA SAFER for company safety records
Integrating these checks into your carrier master data keeps you working with qualified, compliant carriers.
Increased Supply Chain Visibility
End-to-end visibility means seeing your shipment from quote to delivery in one system instead of piecing together information from carrier portals, forwarded emails, and phone calls. Transparency improves customer service: when you have accurate shipment data, you can proactively update customers about delays or delivery windows rather than reacting to inquiries.
Types of Freight Analytics Every Shipper Should Know
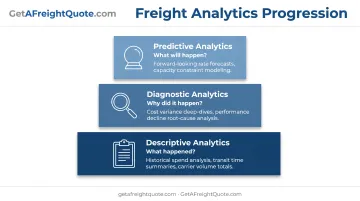
Freight analytics usually falls into three layers. Each answers a different question about spend, service, and risk.
Descriptive Analytics
Descriptive analytics reports on what already happened: total spend by lane, shipments per carrier, average transit times, and accessorial charges as a share of total cost. This is your baseline.
DAT IQ provides lane rates, historical pricing trends, and visibility into spot and contract rates, which supports descriptive cost analysis.
Diagnostic Analytics
Diagnostic analytics explains why results changed—for example, why costs rose on a lane, why a carrier's on-time performance dropped, or why invoice discrepancies spiked.
Invoice validation and compliance checks are diagnostic tools that surface root causes of cost variance.
Predictive Analytics
Predictive analytics forecasts what is likely next: rate moves, seasonal volume shifts, capacity constraints, or service disruptions. Probability-based forecasting helps you decide before events occur, not only after.
Essential Freight Data Metrics to Track
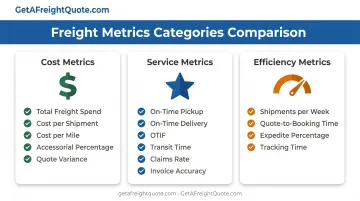
Focus on metrics that tie together spend, carrier performance, and day-to-day operations. Cost, service, and efficiency KPIs give you a baseline you can track by lane, mode, and carrier.
Cost Metrics
- Total freight spend: All transportation costs across modes and carriers
- Cost per shipment: Total freight cost divided by number of shipments, normalizing spend as volume changes
- Cost per mile: All-in freight cost divided by loaded miles; recommended for evaluating FTL price fairness
- Accessorial charges as percentage of total cost: Identifies whether fees such as liftgate, residential, or reweigh charges are becoming a cost driver
- Variance between quoted and actual costs: Flags billing errors and helps refine future cost estimates
Service Metrics
- On-time pickup rate: Percentage of shipments picked up within the agreed window
- On-time delivery rate: Percentage of shipments delivered on or before the committed date
- OTIF (On-Time In-Full): Orders delivered complete and on time, an APQC-recognized measure that combines timeliness and order accuracy
- Average transit time by lane: Baseline for comparing carrier performance and identifying delays
- Claims rate: Shipments with damage or loss claims divided by total shipments, revealing carrier handling quality
- Invoice accuracy rate: Correct audited invoices divided by total audited invoices
Efficiency Metrics
- Shipments per day or week: Volume trends that support capacity planning
- Average time from quote to booking: Operational speed indicator
- Percentage of shipments requiring expediting: Flags planning or forecasting issues
- Time spent tracking or resolving issues: Administrative overhead that analytics can reduce
APQC defines total transportation cost per $1,000 revenue as a normalization metric. Use it to compare freight efficiency across periods even when revenue changes.
How to Get Started with Freight Data Analytics
You don't need a massive IT project to put freight analytics to work. Use these four steps.
Centralize data collection Gather shipping data in one place instead of scattering it across spreadsheets, email confirmations, carrier portals, and paper bills of lading. Without that foundation, you can't compare lanes, benchmark carriers, or spot trends.
Choose technology that matches your needs Pick a TMS with built-in analytics so you aren't juggling separate tools, manual exports, or custom BI builds. GetAFreightQuote.com, for example, lets small and mid-sized shippers benchmark negotiated rates against the market, track carrier performance, and monitor spend by lane and mode in one system—alongside rate shopping across 100+ carriers and shipment-visibility dashboards.
Focus on actionable metrics first Don't track everything at once. Start with 5–7 metrics tied to cost and service: total spend, cost per shipment, on-time delivery, claims rate, and invoice accuracy. When those are stable, add diagnostic and predictive layers.
Establish regular review rhythms Review freight data weekly or monthly to catch trends early and adjust your shipping strategy. Keep operational alerts continuous; time formal scorecards and budget reviews to your contracting cycle and shipment frequency.
Frequently Asked Questions
What is data analytics in logistics?
Data analytics in logistics is the systematic analysis of supply chain data—including transportation, warehousing, and inventory information—to optimize operations, reduce costs, and improve decision-making. Freight analytics is a specialized application focused specifically on shipment and carrier performance.
What's the difference between freight analytics and business intelligence?
Freight analytics focuses specifically on transportation and shipping data—such as lanes, rates, carriers, shipment milestones, invoices, and claims. Business intelligence is broader and covers all aspects of business operations, including sales, finance, and HR. Freight analytics applies BI principles to logistics.
Do I need expensive software to use freight data analytics?
No. Modern TMS platforms include built-in analytics capabilities, so you don't need separate expensive BI tools. The key is choosing a platform that offers analytics appropriate to your shipping volume and complexity, with features such as spend tracking, carrier scorecards, and market-rate benchmarking.
How much data do I need before analytics becomes useful?
You can start seeing value with as few as 50–100 shipments of historical data, as patterns in carrier performance, cost trends, and lane efficiency become visible quickly once data is centralized. For more comprehensive benchmarking and forecasting, 6–12 months of shipment history provides stronger baselines.
What's the ROI timeline for implementing freight analytics?
Most shippers see ROI within the first quarter through cost savings from better carrier selection and rate negotiations. The timeline depends on your baseline rates, shipping volume, and data quality, but invoice recovery, mode optimization, and accessorial reduction often deliver immediate returns.
Can freight analytics help me negotiate better carrier rates?
Yes. Analytics provides the data leverage you need in negotiations by showing carriers your shipping volumes, patterns, lane density, and consistency. Demonstrating your value as a customer with concrete numbers—rather than anecdotal claims—leads to better rate discussions and stronger contract terms.