For shippers moving steel, construction materials, heavy machinery, or oversized equipment, this disconnect matters. A rate that looked reasonable in March might be badly underpriced by August, and budgets built on last year's numbers are already out of date.
This guide breaks down where flatbed rates actually stand right now, the forces pushing them higher, and the specific moves shippers can make to avoid overpaying while capacity stays tight.
Key Takeaways
- Flatbed spot rates hit $2.83/mile, up nearly 40% year-over-year despite falling load postings
- Southeast lanes average $3.48/mile, well above the $2.03/mile seen in the Lower Mountain region
- A shrinking pool of trucks and drivers, not rising demand, is driving higher rates
- Fuel costs, enforcement blitzes, and construction cycles add seasonal pressure on rates
- Benchmarking quotes against current data and comparing carriers helps shippers avoid overpaying
Current Flatbed Freight Rate Landscape in 2026
The numbers tell a strange story this year. National flatbed spot linehaul sat at $2.83 per mile, excluding fuel, for the week ending August 3 — down slightly week-over-week but up 39.6% year-over-year, according to DAT's August 2026 flatbed report. Contract linehaul rates ran a touch higher at $2.91/mile.
Those national averages mask sharp regional swings. Shippers moving freight out of industrial corridors are paying a real premium compared to those in oversupplied regions.
| Origin Region | Rate per Mile | YoY Change |
|---|---|---|
| Southeast | $3.48 | +53.6% |
| Ohio River | $3.29 | +50.4% |
| Carolinas | $3.20 | +50.2% |
| South Central | $2.98 | +47.3% |
| California | $2.63 | +52.2% |
| Upper Atlantic | $2.55 | +33.6% |
| Lower Mountain | $2.03 | +41.3% |
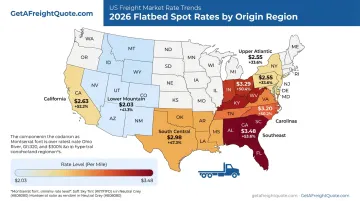
Southeastern and industrial-belt origins consistently outpace western and northeastern lanes. If your freight originates in the Carolinas or the Ohio River corridor, budget accordingly.
Load-to-Truck Ratios: What They Reveal
The load-to-truck ratio measures available loads against available equipment in real time. A higher number means fewer trucks chasing more freight, and it's the clearest signal of where pricing power sits.
The national flatbed ratio hit 41.06 in early August, up from 39.47 the week before and more than 24.01 a year earlier. Here's the part that trips people up: load postings actually fell 4.2% that week. But truck postings fell faster, dropping 8.0%. Capacity is shrinking quicker than demand, and that's what keeps pushing both the ratio and rates upward.
Spot vs. Contract Rates
Spot rates are negotiated shipment-by-shipment based on current market conditions. Contract rates are pre-negotiated for recurring lanes, typically locked in for months at a time.
Right now, contract rates run about $0.08/mile above spot ($2.91 versus $2.83). That's a narrower gap than shippers might expect, and it flips the usual playbook. Contract works best for consistent, high-volume lanes where budget predictability matters more than chasing short-term dips, while spot works best for one-off shipments, sudden demand spikes, or lanes you run infrequently.
When the gap narrows this much, it's worth re-checking whether your existing contract rates still reflect fair market value.
Top Trends Shaping Flatbed Rates in 2026
Four forces are driving flatbed pricing this year, and they don't all move on the same timeline.
Trend 1: Sustained Rate Growth Despite Falling Load Volumes
Historically, flatbed rates and load volumes rise and fall together. Not this year. DAT reported four consecutive weeks of rate increases back in February, and by June, spot linehaul hit $2.94/mile, up 40% year-over-year, even as postings dropped 21% over the preceding month.
This points to a capacity problem: equipment and driver supply have contracted faster than freight demand. When rates climb even as volume falls, a quick reversal becomes unlikely.
Trend 2: Fuel Price Volatility Reshaping Total Rate Calculations
Diesel prices don't move evenly across the country, and that creates real budgeting gaps.
| Region | Diesel Price (Aug 3, 2026) |
|---|---|
| National average | $5.348/gal |
| California | $6.716/gal |
| Midwest | $5.262/gal |
| Gulf Coast | $5.141/gal |
A shipper quoting a California-to-Midwest lane needs to account for over a dollar-per-gallon spread. And here's the catch: DAT's published linehaul rates ($2.83 spot, $2.91 contract) exclude fuel entirely. The all-in rate (what actually hits your invoice) runs meaningfully higher once fuel surcharges are layered on. Always ask whether a quote is linehaul-only or all-in before comparing carriers.
Trend 3: Regulatory Enforcement Events Temporarily Tightening Capacity
The 2026 CVSA International Roadcheck ran May 12-14, a 72-hour inspection blitz focused on cargo securement and ELD compliance. Events like this pull trucks off the road for inspection, and the effect on rates is measurable.
FreightWaves reported that Roadcheck weeks have historically produced spot-rate spikes of 6-8%, with flatbed tender rejections running roughly 7.5% higher around the 2025 event. If you're booking freight near a known enforcement date, build in extra lead time, and expect to pay a premium if you wait until the last minute.
Trend 4: Construction and Industrial Demand Recovery
Flatbed freight tracks construction and industrial output far more closely than van or reefer freight tracks consumer spending. That means flatbed demand cycles run longer and shift more slowly.
June construction spending came in at $2.17 trillion (seasonally adjusted annual rate), down slightly month-over-month but with nonresidential construction actually ticking up 0.1%. Industrial production rose 1.1% year-over-year, with manufacturing output climbing at a 4.7% annualized pace in the second quarter. Steady, if unspectacular, growth — but enough to keep flatbed demand from softening the way van freight has in past cycles.
What's Driving These Rate Trends
Behind all four trends sits one core statistic: truck postings fell 24.8% year-over-year while load postings rose 28.6%. That gap is the entire story.
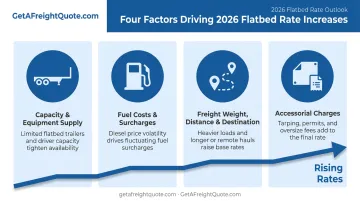
Four factors are driving that gap:
- Capacity and equipment supply: Specialized flatbed trailers and qualified drivers remain scarce, a textbook setup for rising rates that explains why the load-to-truck ratio has nearly doubled year-over-year.
- Fuel costs and surcharges: Regional diesel price gaps of a dollar or more per gallon mean identical lanes can carry very different all-in costs depending on origin.
- Freight weight, distance, and destination: Heavier loads, longer hauls, and off-route destinations still cost more, and these fundamentals now stack on top of a tighter capacity baseline than shippers saw in 2025.
- Accessorial charges: Tarping fees, oversize permits, and detention pay are showing up more often on flatbed invoices — ask for an itemized breakdown to separate linehaul costs from add-ons.
Which Flatbed Loads and Lanes Pay the Most
Not all flatbed freight commands the same premium. Two factors consistently push rates higher.
Specialized and oversized cargo. Steel, heavy machinery, and construction equipment require specialized trailers, permits, and handling, so carriers price accordingly. Standard flatbed runs $2.50-$3.50/mile in most markets, but hazmat and oversized loads on specialized lanes can top $4.00/mile.
Imbalanced, low-density lanes. Routes without reliable backhaul freight force carriers to price in the deadhead miles. Texas outbound flatbed hit a record $3.40/mile in June, 65 cents above the previous record set during the 2022 capacity crunch.
Currently, the tightest capacity (and highest pay) sits in:
- Southeast ($3.48/mile)
- Ohio River corridor ($3.29/mile)
- Carolinas ($3.20/mile)
If your freight moves through these regions, expect to pay industrial-belt premiums regardless of load type.
How Shippers Can Navigate Rising Flatbed Rates in 2026
Volatility like this rewards shippers who actively manage their freight spend instead of accepting the first quote that lands in their inbox.
Benchmark every quote. Before booking, check it against current market data. A rate that looked fair last month may already be stale given how fast the load-to-truck ratio has moved.
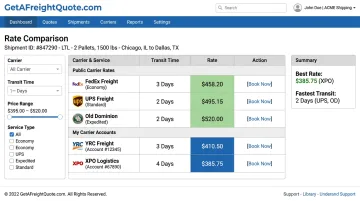
Compare multiple carriers, not just one. Relying on a single carrier relationship leaves you exposed when spot rates swing. Getting three or four options side-by-side, ideally in one place, is the fastest way to spot an outlier quote.
This is where a platform like GetAFreightQuote.com fits into the picture. It gives small and mid-sized shippers access to negotiated carrier rates and enterprise-grade TMS technology, the same tools larger shippers use, without requiring Fortune 500-level shipment volume.
The platform's broader carrier network has helped shippers achieve 20-50% rate reductions across its service lines. Shippers can also layer their own existing carrier accounts into the system alongside GetAFreightQuote.com's negotiated rates, so every shipment gets rate-shopped automatically rather than booked on a single carrier's word.
Match your rate strategy to your shipping pattern. For recurring flatbed lanes, locking in contract rates during high-volatility periods provides budget stability. Reserve spot bookings for one-off shipments or urgent freight where flexibility matters more than predictability.
Frequently Asked Questions
What are current flatbed rates per mile?
National flatbed spot linehaul sits at $2.83/mile, with contract rates slightly higher at $2.91/mile, per DAT's August 2026 data. Regional rates vary widely, from $2.03/mile in the Lower Mountain region to $3.48/mile in the Southeast.
Are flatbed rates expected to go up in 2026?
Rates have shown multiple consecutive weeks of growth even as load volumes fell, pointing to a genuine capacity shortage rather than a temporary demand spike. This structural tightness makes a quick reversal unlikely in the near term.
What flatbed loads pay the most?
Oversized and specialized cargo (steel, heavy machinery, construction equipment) commands premium rates due to equipment and permit requirements. Imbalanced lanes with limited backhaul freight also pay above-average per-mile rates.
What factors influence flatbed freight rates the most?
Fuel costs, load-to-truck capacity ratios, distance and freight weight, and accessorial charges like tarping and permits all factor into total rate calculations. Capacity scarcity is currently the dominant driver.
What's the difference between flatbed spot rates and contract rates?
Spot rates are negotiated per shipment based on real-time market conditions, while contract rates are pre-negotiated for recurring lanes over a set period. Spot offers flexibility; contract offers budget predictability.
How can small businesses get better flatbed shipping rates?
GetAFreightQuote.com's rate transparency tools and negotiated carrier networks give small shippers pricing typically reserved for high-volume accounts. Comparing multiple carriers, not just one relationship, is the fastest way to cut costs.