Introduction
Dry vans haul the bulk of America's non-perishable freight — everything from packaged goods to retail inventory to industrial parts. So when dry van rates move, most shippers feel it.
For much of the past two years, that movement was mostly downward. Not anymore.
2026 is different. Dry van spot rates jumped 45% year-over-year by June, according to DAT Freight & Analytics. This time, shrinking capacity is driving prices up, not a demand spike.
Fewer drivers, tighter eligibility rules, and shifting fleet strategies are resetting the market from the supply side.
That distinction matters for anyone budgeting freight or negotiating a contract this year. Here's what's actually happening, why it's happening, and what to do about it.
Key Takeaways
- Dry van spot rates jumped 45% year-over-year in June 2026 as capacity tightened, not demand
- Contract rates are breaking out of stagnation as spot strength flows into bid cycles
- Southeast and West per-mile rates now outpace the Northeast by 60 cents or more
- Weekly rate swings stay sharp, so last month's average won't predict next week's cost
- Small and mid-sized shippers can still land enterprise-level rates via modern TMS tools
Key Trends Shaping Dry Van Freight and Spot Rates in 2026
These four trends reflect a market climbing out of a multi-year freight recession and into a capacity-driven upturn. Unlike past rate spikes triggered by sudden demand surges, this one is being built from the supply side, and that tends to make it stickier.
Trend 1: A Capacity-Driven Structural Rate Reset
Driver scarcity, not booming freight volume, is the main force pushing dry van rates up. The American Trucking Associations counted 3.58 million professional drivers in 2024, down 0.8% year-over-year, a modest decline on paper but one that's compounding alongside stricter eligibility rules and fleet consolidation.
The numbers back it up. DAT's June 2026 data shows dry van spot linehaul (rates with fuel stripped out) at $2.37 per mile, up 45% year-over-year. That's a sharp move for a metric that spent 2023 and 2024 mostly flat.
Why this cycle looks different:
- Previous rate spikes (2018, 2021) tracked closely with freight demand surges
- This one is happening even as demand growth stays uneven across sectors
- A shrinking carrier pool tends to create a more durable rate floor than a temporary demand bump
This time, shippers can't just wait out the reset the way they rode out past seasonal spikes.
Trend 2: Contract Rates Catching Up to Spot Market Strength
Contract linehaul rates spent much of 2024 and 2025 stuck in a tight band, hovering in the low-$2.30s per mile with barely any quarter-over-quarter movement. That holding pattern is finally cracking.
By June 2026, contract linehaul had climbed 12% year-over-year to $2.26 per mile, while spot linehaul jumped 45% to $2.37. As a result, spot rates topped contract rates for the first time since February 2022, per DAT.
This reversal matters because contract rates typically lag spot movements, sometimes by months. The gap closing this fast signals carriers are pushing harder in bid negotiations, and shippers who locked in favorable multi-year contracts during the slow market may see less room to negotiate at renewal.
What this means for bidding and renewal:
- Routing guides built on 2024-2025 assumptions are already outdated
- Carriers have more leverage in this cycle than they've had in years
- Locking in rates too early in a rising market can backfire, but waiting too long carries risk too
Trend 3: Widening Regional Rate Disparities
Shipping origin matters as much as timing. DAT's late-July 2026 report put dry van spot linehaul at $2.75 per mile in California, $2.65 in the Southeast, and just $2.15 in the Upper Atlantic/Northeast. The gap amounts to roughly 60 cents per mile between the priciest and cheapest markets.
That gap isn't random. It comes down to freight imbalance:
- Headhaul markets (more freight leaving than arriving) push rates up as shippers compete for limited capacity
- Backhaul markets (more capacity than outbound freight) push rates down as carriers compete to avoid deadheading
- Regions with strong manufacturing or import activity tend to stay persistent headhaul markets year after year
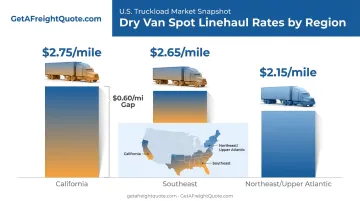
A shipper running lanes across multiple regions can't rely on one national average to budget accurately. A load out of the Southeast and a load out of the Northeast might carry a meaningfully different cost structure even at similar mileage.
Trend 4: Elevated Weekly and Seasonal Volatility
Dry van rates don't move in a straight line. In the week ending July 24, 2026, spot linehaul dropped 2.5% in a single week as load postings fell 7.5% and the load-to-truck ratio eased. It's a reminder that month-to-month averages can mask sharp short-term swings.
Seasonal events compound this. During the combined 2025 International Roadcheck and Memorial Day window, dry van spot rates climbed about 7%, modest compared to reefer's 9% jump but still a meaningful short-term spike.
Recurring volatility triggers:
- Holiday weeks (reduced driver availability, compressed delivery windows)
- Produce season (competition for capacity from reefer lanes)
- International Roadcheck (temporary driver and equipment inspections reduce available capacity)
- Weather events (regional capacity tightening that ripples nationally)
Shippers budgeting off "last month's average rate" risk getting blindsided by a load that ships during one of these windows. Weekly rate-watching, not just monthly reporting, is becoming a necessary habit.
What's Driving These Dry Van Rate Trends
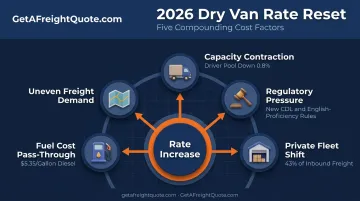
These forces aren't happening in isolation — they're compounding. That's exactly why this reset feels more structural than cyclical.
Capacity contraction. The driver pool shrank 0.8% in 2024 to 3.58 million, per ATA data, while for-hire carriers are restructuring rather than expanding. Some, like Covenant, deliberately trimmed fleet size in early 2026; others, like Werner, grew through acquisition rather than organic hiring.
Regulatory and compliance pressure. Two federal actions are tightening driver eligibility:
- FMCSA restored out-of-service treatment for English-proficiency violations starting June 25, 2025, with continued enforcement guidance through April 2026
- A final rule effective March 16, 2026, narrows non-domiciled CDL eligibility to H-2A, H-2B, and E-2 visa holders, cutting off a driver pipeline that some carriers relied on
Both rules remove drivers from the road without adding new ones, creating a direct capacity squeeze.
Private fleet shifts. Private fleet use rose 11.7% year-over-year in 2024, with private fleets now handling roughly 43% of inbound freight, according to DAT. As more companies build or expand private fleets, they pull volume away from for-hire carriers, tightening the pool available for spot and contract freight.
Fuel cost pass-through. Diesel hit $5.348 per gallon as of early August 2026, per the U.S. Energy Information Administration. Fuel surcharges ride on top of linehaul rates, so diesel swings directly affect the all-in price a shipper pays, separate from the capacity-driven linehaul increases discussed above.
Uneven freight demand. Recovery isn't broad-based. Some lanes and sectors are running hot while others stay soft, which is part of why regional disparities (Trend 3) persist rather than smoothing out.
How These Trends Are Impacting Businesses and Shippers
Leverage has shifted from shippers to carriers. That shift demands new strategies for budgeting, vendor management, and internal resourcing.
Operational Impact
Routing guides built on last year's rate assumptions are quickly becoming outdated. As spot-contract spreads narrow and rates reset faster than usual, freight budgets need more frequent revisiting — quarterly at minimum, monthly in volatile lanes.
Shipping across multiple regions adds another layer of complexity. Tracking a 60-cent-per-mile gap between the Southeast and Northeast means procurement teams can't rely on one blended national rate for planning purposes.
Business Impact
More businesses are turning to rate-comparison technology and freight brokers instead of leaning on a single carrier relationship. This makes sense in a market where rates diverge this much by region and week.
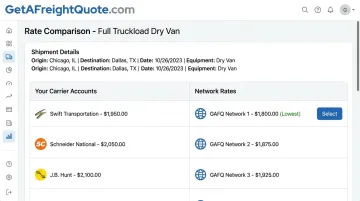
This is where a platform like GetAFreightQuote.com fits into the picture. Rather than forcing a choice between existing carrier contracts and a broker's negotiated rates, its TMS lets businesses load their own carrier accounts alongside pre-negotiated rates. That setup enables side-by-side comparison on every shipment, including full truckload dry van loads.
That comparison extends to a network of vetted truckload carriers. Smaller shippers can access pricing options at a scale usually reserved for high-volume enterprise accounts, without needing Fortune 500 shipment numbers to get there.
Workforce Impact
Internal logistics and procurement teams are stretched thinner. Rebidding cycles that used to happen annually are now happening more often, and tracking regional and weekly rate swings on top of normal workload adds real strain. That pressure is one reason more businesses are leaning on outsourced or tech-assisted freight management instead of managing every rate negotiation in-house.
Future Signals to Watch in Dry Van Rates
Whether this reset holds through 2027 and beyond depends on a few indicators worth tracking:
- Driver pay trends: Wage growth slowed from 7.6% in 2023 to under 1% by early 2025. Whether pay increases enough to draw drivers back into the industry will directly affect how long capacity stays tight.
- Federal Reserve policy: The Fed held its rate target at 3.5%-3.75% as of June 2026. A future rate cut could boost broader business activity and freight demand, adding pressure on top of the current capacity squeeze.
- Continued regulatory enforcement: The non-domiciled CDL rule and English-proficiency enforcement are both still fresh. If enforcement holds or expands, capacity could stay constrained longer than markets currently expect.
None of these are guaranteed outcomes. But each one nudges the rate environment in a specific direction, and shippers who track them will see rate shifts coming before they hit an invoice.
Conclusion
Dry van rates in 2026 aren't spiking because everyone suddenly needs more freight moved. They're resetting because the supply of trucks and drivers available to move it is shrinking, a structural shift that won't reverse with the next freight cycle.
Shippers who track spot-contract spreads and regional rate variance early are in a far better position to negotiate fairly and avoid budget surprises down the line. Those relying on last year's numbers are the ones most likely to get caught off guard.
Market awareness only gets you so far without the right tools to act on it. Pairing that awareness with a platform like GetAFreightQuote.com, which lets you compare carrier rates in real time regardless of shipment volume, keeps pricing fair no matter which direction the market moves next.
Frequently Asked Questions
What is a typical rate for a long haul dry van truck?
As of June 2026, national dry van spot linehaul averaged $2.37 per mile, with all-in spot rates around $3.00 per mile including fuel. Rates vary by region and distance, so check current lane data before budgeting.
Are freight rates going up in 2026?
Yes. Dry van spot linehaul rose 45% year-over-year and contract linehaul rose 12% by June 2026. The increase is driven by shrinking carrier capacity, not a surge in shipping demand.
What's the difference between spot rates and contract rates for dry van freight?
Spot rates are real-time, per-load prices set by current supply and demand. Contract rates are pre-negotiated prices locked in for a set period, typically six months to a year, offering more budget predictability.
Why do dry van freight rates vary so much by region?
Freight imbalances drive the gap — regions with more outbound freight than inbound capacity (like the Southeast and California) see higher rates, while backhaul-heavy regions like the Northeast run lower. This mismatch persists year over year.
How can small and mid-sized businesses get better dry van freight rates despite market volatility?
Comparing multiple carrier rates through a TMS or freight-quote platform gives smaller shippers access to enterprise-level pricing without needing high shipment volume. Weighing your own contracts against pre-negotiated rates side by side shows the clearest savings path.
How do fuel prices affect dry van freight rates?
Diesel prices feed directly into fuel surcharges, which sit on top of linehaul rates to form the all-in price a shipper pays. With diesel at $5.35 per gallon as of early August 2026, fuel remains a major, separate cost driver.